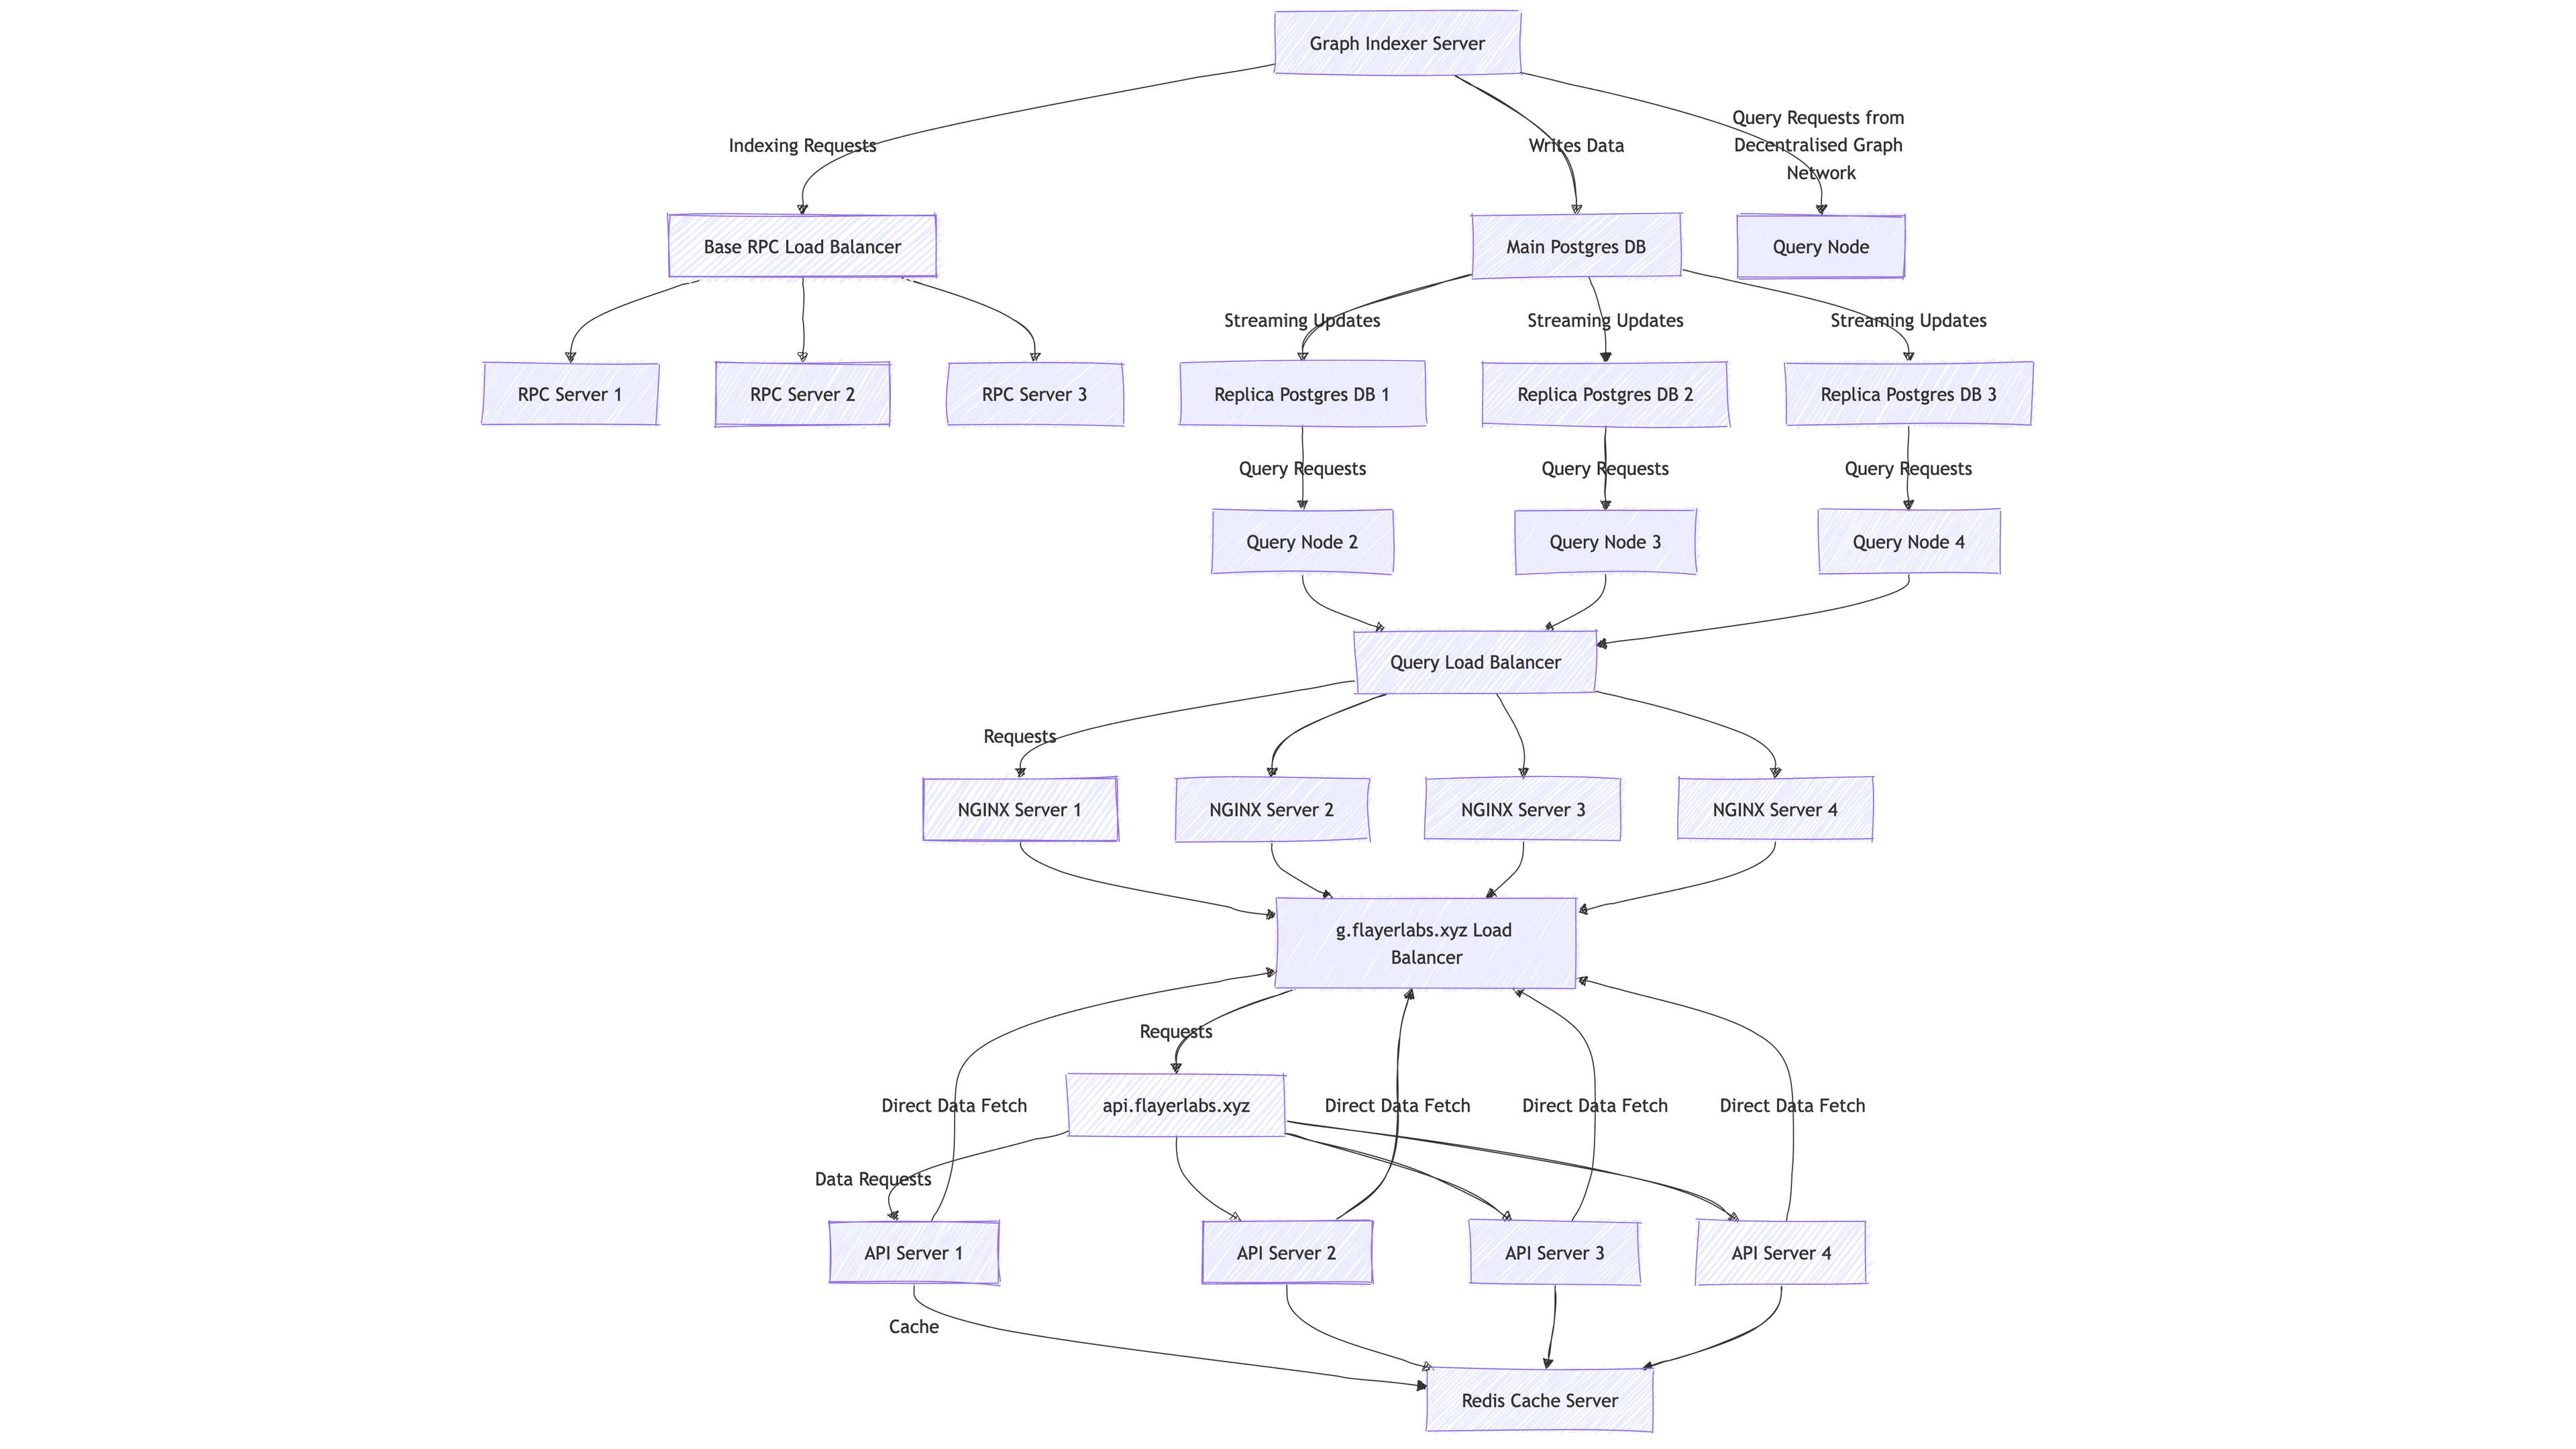
Creating an Infrastructure Diagram for DevOps using Mermaid.live
Creating an infrastructure diagram is a crucial step in understanding and communicating how your DevOps environment is structured. This guide will walk you through the process of creating an infrastructure diagram using Mermaid.live.
Step 1: Understand Your Infrastructure
Before you start creating your diagram, you need to have a clear understanding of your infrastructure. This includes knowing the different components of your infrastructure and how they interact with each other.
Step 2: Use Mermaid Syntax
Mermaid uses a simple markdown-like syntax that allows you to create diagrams using text. Here's an example of how you can represent your infrastructure using Mermaid syntax:
// graphTD

%% Graph Indexer Server

A[Graph Indexer Server]-->|Indexing Requests|B[Base RPC Load Balancer]

B-->RPC1[RPC Server 1]

B-->RPC2[RPC Server 2]

B-->RPC3[RPC Server 3]

%% Postgres DB and Replicas

A-->|Writes Data|C[Main Postgres DB]

C-->|Streaming Updates|D[Replica Postgres DB 1]

C-->|Streaming Updates|E[Replica Postgres DB 2]

C-->|Streaming Updates|F[Replica Postgres DB 3]

%% Query Nodes

A-->|Query Requests from Decentralised Graph Network|Q1[Query Node]

D-->|Query Requests|Q2[Query Node 2]

E-->|Query Requests|Q3[Query Node 3]

F-->|Query Requests|Q4[Query Node 4]

%% NGINX Servers

Q2-->LB1[Query Load Balancer]

Q3-->LB1

Q4-->LB1

LB1-->|Requests|NGINX1[NGINX Server 1]

LB1-->NGINX2[NGINX Server 2]

LB1-->NGINX3[NGINX Server 3]

LB1-->NGINX4[NGINX Server 4]

%% Load Balancer for NGINX

NGINX1-->LB2[g.flayerlabs.xyz Load Balancer]

NGINX2-->LB2

NGINX3-->LB2

NGINX4-->LB2

%% API and User Requests

LB2-->|Requests|H[api.flayerlabs.xyz]

H-->|Data Requests|API1[API Server 1]

H-->API2[API Server 2]

H-->API3[API Server 3]

H-->API4[API Server 4]

API1-->|Cache|Redis[Redis Cache Server]

API2-->Redis

API3-->Redis

API4-->Redis

API1-->|Direct Data Fetch|LB2

API2-->|Direct Data Fetch|LB2

API3-->|Direct Data Fetch|LB2

API4-->|Direct Data Fetch|LB2